- Welcome to The MASM Forum.

News:
Masm32 SDK description, downloads and other helpful links
Message to All Guests
Recent posts
#1
16 bit DOS Programming / Re: Line Drawing
Last post by tda0626 - Today at 10:01:20 AMQuote from: NoCforMe on Today at 08:32:10 AMRemember high-school algebra?
Given 2 points, (x1,y1) & (x2, y2):m = y2 - y1 / x2 - x1
m is the slope.
I know that. Usually the Y values are going to be smaller than the x values so we end up with a fraction but thanks anyway. I will see if I can find something on the Internet that explains it better.
#2
16 bit DOS Programming / Re: Line Drawing
Last post by NoCforMe - Today at 08:32:10 AMRemember high-school algebra?
Given 2 points, (x1,y1) & (x2, y2):
m is the slope.
Given 2 points, (x1,y1) & (x2, y2):
m = y2 - y1 / x2 - x1
m is the slope.
#3
16 bit DOS Programming / Re: Line Drawing
Last post by tda0626 - Today at 08:20:51 AMQuote from: NoCforMe on Today at 06:57:57 AMHint: at least two ways to do that:
2. Check the value of y each time through the loop to see if it's at the bottom of the screen.
Thanks, I got it to work. I was overthinking it for some reason when it was simple. I also added checks for the other screen borders.
How would I implement a slope? I want to eventually input start and end coordinates.
#4
The Orphanage / Re: Nugget finds a Turtle
Last post by sudoku - Today at 07:33:47 AMQuote from: NoCforMe on Today at 07:29:05 AMStupid dog. Patient turtle.

Nah, she's still learning and definitely not stupid. Its the first time she had seen a snapping turtle up close. She sees them all the time around the edge of our pond, and chases them off and back into the pond.
#5
The Orphanage / Re: Nugget finds a Turtle
Last post by NoCforMe - Today at 07:29:05 AMStupid dog. Patient turtle.
#6
16 bit DOS Programming / Re: Line Drawing
Last post by NoCforMe - Today at 06:57:57 AMYour "slope" isn't really the slope of the line (your actual slope is negative), but let's not worry about that for the moment: it's really the offset to the next y-position down for the next drawn pixel.
Your problem is not that the "slope" is increasing (it's not, it stays constant at 3) but that you're hitting the bottom line and wrapping around in the video buffer. So if you want to stop drawing at the bottom of the screen, then check to see if your y-position is at or past the bottom line, then exit your loop. (I'll leave it up to you to figure out how to determine that.)
Hint: at least two ways to do that:
1. Set your loop counter to a value that you know will only draw pixels to the bottom of the screen and stop.
2. Check the value of y each time through the loop to see if it's at the bottom of the screen.
#7
16 bit DOS Programming / Re: Line Drawing
Last post by sudoku - Today at 06:28:37 AMOnce you have clearly defined boundaries, you must tell the program what to do once a boundary is met.
Change direction, stop, start at a new x,y position, etc.
I don't know how to do it in 16 bit and as you have coded it, but it shouldn't be very difficult to implement.
You should be able to draw the lines as if it were a bouncing ping ping ball (staying within the boundaries), is that what you had in mind? (Where the lines appear to be bouncing off the 'walls'?).
After looking at the code again...
Then you wouldnt need the
Change direction, stop, start at a new x,y position, etc.
I don't know how to do it in 16 bit and as you have coded it, but it shouldn't be very difficult to implement.
You should be able to draw the lines as if it were a bouncing ping ping ball (staying within the boundaries), is that what you had in mind? (Where the lines appear to be bouncing off the 'walls'?).
After looking at the code again...
Code Select
        dec cx
        jmp DrawLine
that jump should be jnz maybe, rather than jmp???Then you wouldnt need the
Code Select
cmp cx, 0
je EndLine
further up in the code. #8
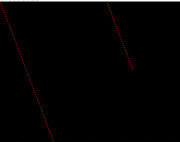
16 bit DOS Programming / Line Drawing
Last post by tda0626 - Today at 06:22:25 AMI got a basic line drawing routine but I want it to stop it from wrapping around like in the image below if the slope value starts increasing.
Code Select
.model small


Stack	SEGMENT STACK
	DW 256 DUP(?)
Stack	ENDS

.data

red	db	028h
x 		DW	?
y  		DW	?
slope	DW	?

.code

_main proc

	mov ax, @data
	mov ds, ax

	mov ax, 0A000h		;video memory
	mov es, ax
	xor di, di

	mov ah, 0			; 320 x 200
	mov al, 013h
	int 10h

	mov x, 0				; Starting Coordinates
	mov y, 0
	mov cx, 100			; 100 pixel line
	mov slope, 3			; Slope of the line

	DrawLine:

		mov ax, y		; Calculate offset in video memory
		mov bx, 320		; Y * 320 + X
		mul bx
		add ax, x

		mov di, ax		; Set DI to our offset value
		mov al, red
		mov es:[di], al	; Write a red pixel to memory


		cmp cx, 0
		je EndLine

		mov ax, y		; Add the slope to the line
		add ax, slope
		mov y, ax
		inc x

		dec cx
		jmp DrawLine

	EndLine:

	mov ah, 0			; wait for key press
	int 16h

	mov ax, 04c00h		; exit
	int 21h

_main endp
end _main
#9
The Orphanage / Nugget finds a Turtle
Last post by sudoku - Today at 06:02:31 AMNo turtles, or puppy dogs were harmed in the making of this film.

#10
The Laboratory / Re: DBScan, Homogeneity and Co...
Last post by guga - Today at 12:17:37 AMSucceeded to automate the process of identifying Epsilon and Minimum Points. For the articles i´m reading, the smaller epsilon, the better.
https://hyperskill.org/learn/step/31529
https://mrinalyadav7.medium.com/dbscan-algorithm-c894701306d5
On the attached version, it generated only 2 epsilon values.
On the function find_knee_point it creates a table of distances values (possible values of epsilon) forming a array of data (Size is NumPoints *8 = 8 because we are dealing with a Real8). The generated contents are displaced in ascending order On the example we have 53 values, on 2 unique epsilon values from the smaller to the bigger.
The function chooses one located at the 10% of the initial data in the array. Later i´ll make a routine to get rid of the duplicated data, and insert the different values on another table to make easier the user choose what type of data we wants do identify.
according to the 2nd article, Epsilon can be better described as:
Btw,, so far, chatgpt didn´t succeeded to help me making the algo way more fast. It is incredibly slow when working on real images. The alternative i proposed was create a table in memory to directly point to the addresses in get_neighbor routines, but it turns out that i´ll need a insane huge table for that (NumPixels*8*NumPixels). I´m trying to overcome this, and use only 1 table (size = Numpixes*8) and then, make some lighter arithmetic function to calculate the values of the next indexed tables. Thinking how to do it yet....
About epsilon and minimum points, chatgpt answered me like this (That proven to be correct at the end)
His piece of code was originally this:
And then it answered me:
The resultant values were the same i´ve got earlier, so, it seems the routines i created to automate epsilon and min points were correct
And below are some links i found with examples on how to create a faster library for it:
https://github.com/Eleobert/dbscan
https://proceedings.mlr.press/v157/weng21a.html
I didn´t tested this new routines yet, neither ported it co Plain C or assembly yet. Thinking....
https://hyperskill.org/learn/step/31529
https://mrinalyadav7.medium.com/dbscan-algorithm-c894701306d5
On the attached version, it generated only 2 epsilon values.
Code Select
Main:
....
        call GetMinPoints DBSCAN_DIM_1D
        mov D$MinPoints eax
        call GetEpsilon D$points, D$Num_Points, Epsilon, DBSCAN_DIM_1D


        call dbscan D$points, D$Num_Points, Epsilon, D$MinPoints, Homogeneity, HomogeneityLog
....
Code Select
;;
   Automatically find epsilon
   http://www.sefidian.com/2022/12/18/how-to-determine-epsilon-and-minpts-parameters-of-dbscan-clustering/
   https://mrinalyadav7.medium.com/dbscan-algorithm-c894701306d5
   https://hyperskill.org/learn/step/31529
;;

[DBSCAN_DIM_1D 1]
[DBSCAN_DIM_2D 2]
[DBSCAN_DIM_3D 3]

Proc GetMinPoints:
    Arguments @DimensionFlags

    mov eax D@DimensionFlags
    shl eax 1

EndP

Proc GetEpsilon:
    Arguments @points, @num_points, @pOutput, @Flag
    Local @k_distances, @kFactor
    Uses ebx, esi, edi, ecx, edx

    xor eax eax
    On D@num_points = 0, ExitP

    C_call 'msvcrt.calloc' D@num_points, 8
    mov D@k_distances eax

    mov eax D@Flag
    .If_Or eax = DBSCAN_DIM_1D, eax = 0
        mov eax 2 ; dimensions*2) = 1*2
    .Else_If eax = DBSCAN_DIM_2D
        mov eax 4 ; dimensions*2) = 2*2
    .Else_If eax = DBSCAN_DIM_3D
        mov eax 6 ; dimensions*2) = 3*2
    .Else_If_And eax > 3, eax < 7
        mov eax 7
    .Else_If eax > 10
        inc eax
    .End_If
    mov D@kFactor eax

    ; Calculate k-distances for each point
    call calculate_k_distances D@points, D@num_points, D@kFactor, D@k_distances
    call find_knee_point D@k_distances, D@num_points

    mov eax D@pOutput | fstp R$eax

    C_call 'msvcrt.free' D@k_distances

EndP

; Function to calculate k-distance for each point

Proc calculate_k_distances:
    Arguments @points, @num_points, @kFactor, @k_distances
    local @Distances, @PointsIPos
    Uses ebx, esi, edi, ecx, edx

    xor eax eax
    On D@num_points = 0, ExitP

    C_call 'msvcrt.calloc' D@num_points, 8
    mov D@Distances eax
    mov ebx eax
    mov esi D@points
    mov D@PointsIPos esi
    xor edi edi

    .Do

        mov esi D@points
        xor ecx ecx
        Do

            call euclidean_dist D@PointsIPos, esi
            fstp R$ebx+ecx*8
            add esi Size_Of_point_t
            inc ecx
        Loop_Until ecx >= D@num_points ; jl

        C_call 'msvcrt.qsort' ebx, D@num_points, 8, compare_doubles
        ;  k-th nearest neighbor distance
        mov eax D@kFactor
        mov edx D@k_distances
        fld R$ebx+eax*8 | fstp R$edx+edi*8

        add D@PointsIPos Size_Of_point_t
        inc edi
    .Loop_Until edi >= D@num_points

    C_call 'msvcrt.free' D@Distances

EndP

Proc compare_doubles:
    Arguments @Arg1, @Arg2

    mov eax D@Arg1 | movsd XMM0 X$eax
    mov eax D@Arg2 | movsd XMM1 X$eax

    xor eax eax
    SSE_D_If xmm1 > xmm0
        mov eax 0-1
    SSE_D_Else_If xmm1 < xmm0
        mov eax 1
    SSE_D_End_If

EndSTD

[KneeRate: R$ 0.1]

Proc find_knee_point:
    Arguments @k_Distance, @Num_Points
    Local @KneeIndex
    Uses ebx, esi, ecx, edx

    mov ebx D@k_Distance
    mov esi D@Num_Points
    C_call 'msvcrt.qsort' ebx, esi, 8, compare_doubles
    fild D@Num_Points | fmul R$KneeRate | fistp D@KneeIndex

;fld R$ebx;+eax*8
;mov eax 52 | fld R$ebx+eax*8

    mov eax D@KneeIndex | fld R$ebx+eax*8

EndP
On the function find_knee_point it creates a table of distances values (possible values of epsilon) forming a array of data (Size is NumPoints *8 = 8 because we are dealing with a Real8). The generated contents are displaced in ascending order On the example we have 53 values, on 2 unique epsilon values from the smaller to the bigger.
The function chooses one located at the 10% of the initial data in the array. Later i´ll make a routine to get rid of the duplicated data, and insert the different values on another table to make easier the user choose what type of data we wants do identify.
according to the 2nd article, Epsilon can be better described as:
Quoteε: The value for ε can then be chosen by using a k-distance graph, plotting the distance to the k = minPts-1 nearest neighbor ordered from the largest to the smallest value. Good values of ε are where this plot shows an "elbow": if ε is chosen much too small, a large part of the data will not be clustered; whereas for a too high value of ε, clusters will merge and the majority of objects will be in the same cluster. In general, small values of ε are preferable, and as a rule of thumb, only a small fraction of points should be within this distance of each other.
Btw,, so far, chatgpt didn´t succeeded to help me making the algo way more fast. It is incredibly slow when working on real images. The alternative i proposed was create a table in memory to directly point to the addresses in get_neighbor routines, but it turns out that i´ll need a insane huge table for that (NumPixels*8*NumPixels). I´m trying to overcome this, and use only 1 table (size = Numpixes*8) and then, make some lighter arithmetic function to calculate the values of the next indexed tables. Thinking how to do it yet....
About epsilon and minimum points, chatgpt answered me like this (That proven to be correct at the end)
QuoteThe choice of k is not strictly fixed and can vary based on the characteristics of the data and the specific requirements of the clustering task. Here's a more detailed explanation of how to determine an appropriate k value for different dimensions:
1D Data
For 1D data, clusters are linear, and local density is easier to determine. Therefore, a small k value is usually sufficient.
k = 2: Using the nearest neighbor (1st neighbor) can be enough to define local density in 1D data.
2D Data
For 2D data, clusters are more complex, and you generally need a slightly larger k to capture the local density effectively.
k = 4: This is a commonly used heuristic. A point and its three nearest neighbors can adequately define a local dense region in 2D space.
3D Data
For 3D data, the complexity increases due to the additional dimension, requiring a larger k value to capture the local density accurately.
k = 6: This value is chosen to include a point and its five nearest neighbors, which helps define the local density in 3D space.
k = 7-10: Depending on the noise level and the expected cluster structure, you might need a larger k to ensure robustness.
Choosing k Based on Dimensions
The heuristic k = dimensions + 1 is a starting point, but it may need to be adjusted based on empirical observations and the specific dataset. The values mentioned (e.g., k = 6 for 3D) come from practical experience and empirical studies in clustering literature, where a slightly larger k helps to better capture the density in higher dimensions.
Example Adjustments in Code
Here is how you can set k based on the dimensionality of your data and adjust it if necessary:
His piece of code was originally this:
Code Select
#include <math.h>
#include <stdlib.h>
#include <stdio.h>

// Structure to represent a point in 3D (adjust for higher dimensions if needed)
typedef struct {
    double x, y, z; // Add more dimensions as necessary
} point_t;

// Function to calculate Euclidean distance between two points
double euclidean_distance(point_t *a, point_t *b) {
    return sqrt(pow(a->x - b->x, 2) + pow(a->y - b->y, 2) + pow(a->z - b->z, 2)); // Adjust for dimensions
}

// Function to calculate k-distance for each point
void calculate_k_distances(point_t *points, int num_points, int k, double *k_distances) {
    for (int i = 0; i < num_points; ++i) {
        double distances[num_points];
        for (int j = 0; j < num_points; ++j) {
            distances[j] = euclidean_distance(&points[i], &points[j]);
        }
        // Sort distances to find the k-th nearest neighbor
        qsort(distances, num_points, sizeof(double), compare_doubles);
        k_distances[i] = distances[k]; // k-th nearest neighbor distance
    }
}

// Comparison function for qsort
int compare_doubles(const void *a, const void *b) {
    double arg1 = *(const double*)a;
    double arg2 = *(const double*)b;
    if (arg1 < arg2) return -1;
    if (arg1 > arg2) return 1;
    return 0;
}

// Function to find the "knee" point in k-distances plot
double find_knee_point(double *k_distances, int num_points) {
    // Sort the k-distances to create the k-distances plot
    qsort(k_distances, num_points, sizeof(double), compare_doubles);
    // Simple heuristic: return the distance at the 90th percentile
    return k_distances[(int)(0.9 * num_points)];
}

int main() {
    // Assuming points is already populated
    point_t *points = ...; // Replace with actual points initialization
    int num_points = ...; // Replace with actual number of points
    int dimensions = 3; // Adjust based on the dimensionality of your data
    int k = dimensions + 3; // Adjusted heuristic for k (example: dimensions + 3)
    double k_distances[num_points];

    // Calculate k-distances for each point
    calculate_k_distances(points, num_points, k, k_distances);
    // Find a suitable epsilon using the knee point of the k-distances plot
    double epsilon = find_knee_point(k_distances, num_points);
    // Determine minPts, often set as 2 * dimensions
    int minPts = 2 * dimensions;

    // Now run DBSCAN with the calculated epsilon and minPts
    int num_clusters = dbscan_run(points, epsilon, minPts, num_points);

    // Continue with your process...

    return 0;
}
And then it answered me:
QuoteSummary
1D Data: k = 2 is typically sufficient.
2D Data: k = 4 is a commonly used heuristic.
3D Data: k = 6 or k = 7-10 based on noise and cluster structure.
Higher Dimensions: k = dimensions + 1 or slightly higher based on empirical observation.
These values are starting points, and you may need to adjust k based on your specific dataset and the results you observe.
The resultant values were the same i´ve got earlier, so, it seems the routines i created to automate epsilon and min points were correct
Code Select
Epsilon: 1.000000
Minimum points: 2
Homogeneity: 0.000000
Homogeneity(log): 0.877543
Number of points: 53
 x    y    z    cluster_id
-----------------------------
 1.00  3.00  1.00: 0
 1.00  4.00  1.00: 0
 1.00  5.00  1.00: 0
 1.00  6.00  1.00: 0
 2.00  2.00  1.00: 2
 2.00  3.00  0.00: 1
 2.00  4.00  0.00: 1
 2.00  5.00  0.00: 1
 2.00  6.00  0.00: 1
 2.00  7.00  1.00: 3
 3.00  1.00  1.00: 2
 3.00  2.00  1.00: 2
 3.00  3.00  1.00: 2
 3.00  4.00  0.00: 1
 3.00  5.00  0.00: 1
 3.00  6.00  1.00: 3
 3.00  7.00  1.00: 3
 4.00  1.00  1.00: 2
 4.00  2.00  1.00: 2
 4.00  3.00  0.00: 1
 4.00  4.00  0.00: 1
 4.00  5.00  1.00: -2
 4.00  6.00  0.00: 1
 4.00  7.00  1.00: 3
 4.00  8.00  1.00: 3
 5.00  1.00  1.00: 2
 5.00  2.00  0.00: 1
 5.00  3.00  0.00: 1
 5.00  4.00  0.00: 1
 5.00  5.00  0.00: 1
 5.00  6.00  0.00: 1
 5.00  7.00  1.00: 3
 5.00  8.00  1.00: 3
 6.00  1.00  1.00: 2
 6.00  2.00  0.00: 1
 6.00  3.00  1.00: 3
 6.00  4.00  1.00: 3
 6.00  5.00  1.00: 3
 6.00  6.00  1.00: 3
 6.00  7.00  1.00: 3
 7.00  1.00  1.00: 2
 7.00  2.00  0.00: 1
 7.00  3.00  0.00: 1
 7.00  4.00  0.00: 1
 7.00  5.00  1.00: 3
 8.00  1.00  1.00: 2
 8.00  2.00  1.00: 2
 8.00  3.00  0.00: 1
 8.00  4.00  1.00: 3
 8.00  5.00  1.00: 3
 8.00  6.00  1.00: 3
 9.00  2.00  1.00: 2
 9.00  3.00  1.00: 2

Press enter to exit...
And below are some links i found with examples on how to create a faster library for it:
https://github.com/Eleobert/dbscan
https://proceedings.mlr.press/v157/weng21a.html
I didn´t tested this new routines yet, neither ported it co Plain C or assembly yet. Thinking....